 EN
EN
 RU
RU
Gold prices have broken up. Is it real?
It is easy enough to understand why, after the first failure, it is common for a person to avoid repeating a similar situation in the future. Much more difficult to understand is the zeal with which enthusiasts continue to bet on gold’s growth, sometimes at odds with logic.
While gold prices are recovering again and trying to gain a foothold above $ 1,800, analysts and investors in the precious metals market are trying to figure out if this is a real or false breakout upwards.
A breakout is understood as an upward price movement in which resistance is overcome, either the “neckline” or price pressure. It certainly happened with gold prices – for four sessions in a row, futures were confidently trading above $ 1800.
In case of a false breakout, the upward movement fails, and instead of a rise, a fall follows. Such false breakouts have happened to gold more than once over the past year. Quotes often rallied to the top of the $ 1800– $ 1900 region, or even as high as $ 1900, but then fell back to $ 1700 or, in some cases, $ 1600 levels.
Where exactly gold prices need to get to to maintain momentum depends on many factors, and I will try to reliably summarize them.
Let’s talk about the fundamental factors first. Over the past year, gold has failed to cope with its role as an inflation hedge due to constant talk that the Federal Reserve will be forced to immediately raise interest rates to contain inflation, which has reached its highest levels in 30 years.
It is these speculations that have continued to relentlessly push up Treasury yields, including the benchmark 10-year bond, and the dollar over the past 12 months, to the detriment of gold.
However, over the last week, these conversations have subsided, which was a welcome phenomenon for the gold bulls. Fed Chairman Jerome Powell reassured the markets in an emphatic manner that the central bank will be patient and that rates will not be raised until mid-2022 and, most likely, only towards the end of the year.
Powell also reiterated that the rate hike would not be tied to a $ 15 billion a month cut in the Fed’s asset purchase program. Powell’s statements knocked the ground out from under the feet of the dollar, which peaked since September 2020 as recently as Friday. Gold prices, curiously, have only reached their September 2021 highs since they broke up last week.
And even with fluctuations in the dollar and Treasury yields, gold futures showed weakness in early Asian trading on Tuesday, hovering around the $ 1,825 mark. By the beginning of the New York session, the situation may change. However, the bulls are alarmed by a variety of resistance levels, each of which is likely to be more serious than the previous one as the quotes move above $ 1800.
“The first resistance is at $ 1,835 and needs to be broken through convincingly,” said Phillip Streible, precious metals analyst at Blue Lines Futures.
“I recommend option trades to my clients to avoid problems with futures. Before I advise them to buy, the market must close at $ 1840 or higher for two days.”
Daniel Dubrowski, author of the gold blog at DailyFX.com, notes that with the breakout of the $ 1813- $ 1808 resistance on the 4-hour timeframe, gold is targeting the $ 1825- $ 1834 region (this is where futures are currently trading).
“The second level consists of the July peaks,” notes Dubrowski.
“A golden cross may form between the 20 and 50 simple moving averages, with the balance shifting upward. These lines can also play the role of key support in case of declines in the short term. ”
Dubrowski also notes that according to the IG Client Sentiment indicator, approximately 66% of retail investors are now net long gold.
“The maximum size of potential losses increased by 10.30% on a daily basis and by 48.34% on a weekly basis,” the analyst said.
“We usually take the opposite position to the one that dominates the market. The fact that most traders are net long positions would seem to indicate the likelihood of falling prices. However, recent shifts in the distribution of positions mean the market is inclined to grow from the opposite. ”
Analyst Haresh Mengani has a more cautious view on his blog at fxstreet.com.
“From a technical standpoint, a sustained break above $ 1800 last week and admission above $ 1810 favors upside traders,” Mengani notes.
“In this regard, it is quite possible to further strengthen with a test of the strength of a harder barrier in the area of $ 1832-34 with a high supply. However, a pullback below the $ 1800 mark could trigger the closure of some long positions and drive gold towards the $ 1780 level on the way to the $ 1770 support zone. ”
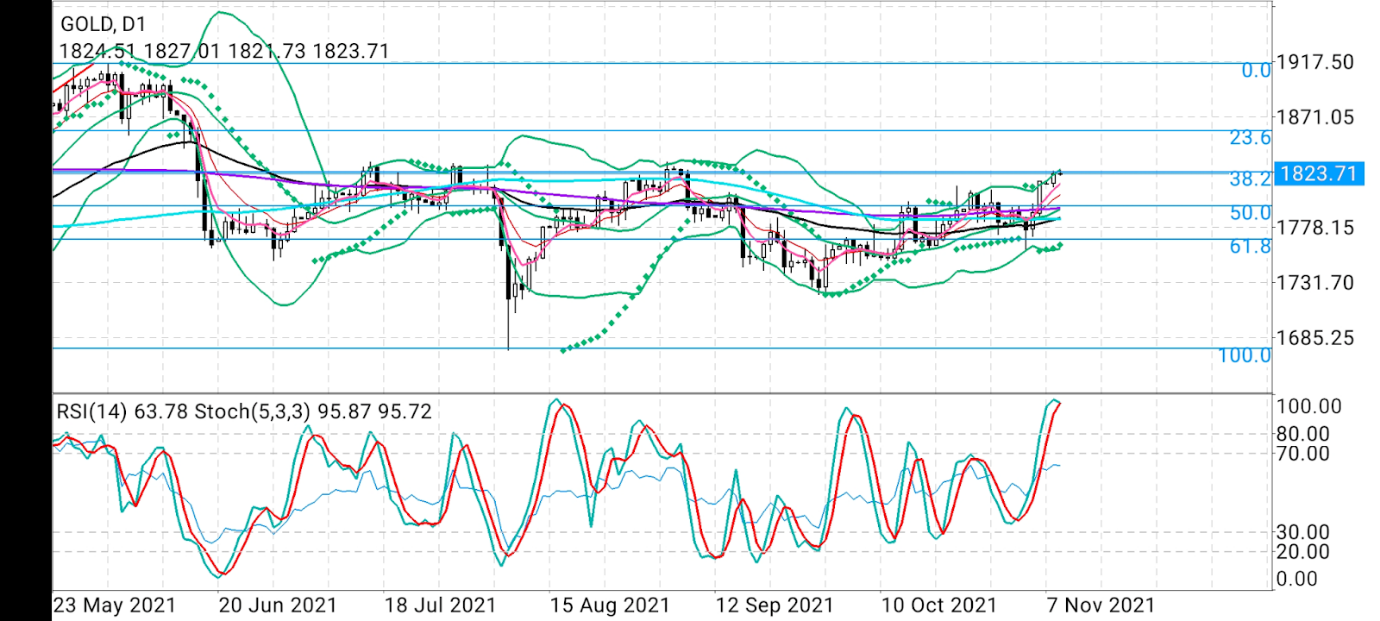
Sunil Kumar Dixit, technical strategist at skcharting.com, notes that the next horizontal and static resistance for gold, based on his forecasts, is in the $ 1833- $ 1835 region.
“Gold’s resolve to gain a foothold above this zone will be put to the test,” says Dixit.
At the same time, the analyst points to overbought on the short-term, daily chart – the RSI indicator is 95/95.
Dixit adds:
“If prices manage to gain a foothold above $ 1835, this should be taken as a signal that they are ready to test the next 23.6% Fibonacci level at $ 1860 for strength. Meanwhile, in case of consolidation and correction, the market will take a limited respite with an eye on $ 1810- $ 1800- $ 1795, which will create a good buying opportunity. ”
Disclaimer: Barani Krishnan cites economic indicators and other analysts’ opinions, sometimes the opposite, to provide a comprehensive analysis of the market. He is not the holder of the commodities and securities positions discussed in the article.